
India's imports of Chinese hot stamping foil grew from $1.30M in 2021 to $6.96M in 2025 — +434%, the largest absolute gain of any destination. A data-led read of what is actually driving it, from 66 months of GACC customs records.
Table of Contents
- 1. The Numbers, Without Commentary
- 2. Why the Price Premium Is the Real Signal
- 3. What Is Actually Pulling the Volume
- 3.1 Pharmaceutical and Nutraceutical Cartons (roughly 25-30%)
- 3.2 Tobacco, Pan Masala and Excise-Grade Printing (roughly 15-20%)
- 3.3 Cosmetics, Personal Care and FMCG Premiumisation (roughly 20%)
- 3.4 Textile Hangtags, Labels and Garment Trim (roughly 15%)
- 3.5 Short-Run Digital and Everything Else (roughly 15-20%)
- 4. Who Ships It, and From Where
- 5. Where the Growth Goes Next
- 6. Practical Guidance
- 7. Where This Analysis Is Weakest
- Frequently Asked Questions
By Gavin Gao — 15+ years in hot stamping foil and post-press machinery. Reach me at gavin@allinpacks.com or on LinkedIn.
Vietnam is still the largest single destination for Chinese hot stamping foil, and has been every year since 2021. But Vietnam is not the story of the last five years. India is. Indian buyers took $1.30 million of Chinese foil in 2021 and $6.96 million in 2025 — a +434% increase, and an absolute gain of $5.66 million, the biggest jump of any of the 146 destination markets in the customs record. Across the whole 2021 – H1 2026 window India absorbed $23.4 million, 15.7% of China's total foil export value, second only to Vietnam's $29.47 million.
Percentage growth from a small base is usually noise. This is not: India moved from a market Chinese producers serviced opportunistically to one that several Wenzhou and Guangdong factories now plan capacity around. This article is my read of why, built on the same GACC dataset behind our China Hot Stamping Foil Export Report 2021 – H1 2026 — HS 32121000 declarations, 66 months, 7,379 records, 146 destinations, 30 origin provinces.
One caution before the numbers. Customs data is complete on what shipped and blind on what it was used for. Where I move from the record to interpretation — end-use verticals, converter behaviour, what happens next — I am reconstructing from customer conversations and my own export book, not proving anything. I will flag it where it matters.
1. The Numbers, Without Commentary
| Metric (2021 – H1 2026) | India | Vietnam |
|---|---|---|
| Cumulative export value | $23.40M | $29.47M |
| Share of China's foil export | 15.7% | 19.7% |
| Cumulative volume | 3,160 t | 5,401 t |
| Average FOB unit price | $7.40/kg | $5.46/kg |
| 2021 annual value | $1.30M | $5.23M |
| 2025 annual value | $6.96M | $6.01M |
| Change 2025 vs 2021 | +434% | +15% |
Read the last two rows together and the headline writes itself: in annual terms India overtook Vietnam in 2025. Vietnam still leads on the five-year cumulative because it started so far ahead, but on current run-rate the ranking has already changed hands.
The second number worth sitting with is unit price. India paid $7.40/kg against Vietnam's $5.46/kg over the same period — a 36% premium, on a market that grew four times faster. That combination is unusual. Fast-growing import markets normally grow on price. India did not.
2. Why the Price Premium Is the Real Signal
China's overall foil export price fell from $8.76/kg in 2022 to $5.93/kg in 2025 as mid-tier Wenzhou producers fought for Southeast Asian volume. India's average sits well above that trend line, and the gap has held for five years rather than narrowing.
Three explanations, in the order I find them convincing:
- Product mix, not generosity. The India book skews toward pigment and specialty grades, holographic and registered material, and anti-counterfeit security foil — categories that price at multiples of plain gold and silver. Vietnam's book skews toward high-turnover metallics for hangtags. Same HS code, very different baskets.
- Domestic competition sets the floor differently. India, unlike Vietnam, has real domestic foil production. Indian mills cover commodity gold and silver competently and cheaply, so Chinese suppliers who show up with a commodity quote lose. What imports instead is what local capacity does not cover well: fine-line registered holographic, difficult substrate adhesion, digital-compatible product, consistent Pantone matching at volume.
- Freight and duty change the arithmetic. Landed cost into Nhava Sheva or Mundra carries basic customs duty plus IGST and a longer transit than a Shenzhen–Cat Lai run. A buyer absorbing that will not do it for a marginal specification.
The practical consequence for Chinese exporters is blunt: India is not a market you win on price. It is a market you win on the specification your domestic competitor cannot hold.
3. What Is Actually Pulling the Volume
The verticals below are my reconstruction from converter conversations, not something the customs line item can prove. Treat the percentages as informed allocation.
3.1 Pharmaceutical and Nutraceutical Cartons (roughly 25-30%)
India is the world's largest supplier of generic medicines by volume, and the carton has become an anti-counterfeiting surface. Track-and-trace mandates for export consignments pushed Indian pharma packaging toward registered holographic and tamper-evident decoration far faster than most markets. This is the single vertical I would name if forced to explain the price premium in one line.
3.2 Tobacco, Pan Masala and Excise-Grade Printing (roughly 15-20%)
Excise-controlled categories run enormous volumes of foil-decorated and security-marked packaging, with specification stability that suits long-term supply relationships. Registered holographic work here is technically demanding — the tolerance conversation is about micrometres of register drift across a running web, not about shade.
3.3 Cosmetics, Personal Care and FMCG Premiumisation (roughly 20%)
The fastest-moving vertical of the past three years. Indian D2C beauty brands and the premium tiers of established FMCG houses have raised finishing expectations sharply, and mid-size converters in Gujarat and Maharashtra have bought the presses to serve it — often with cold stamping foil units inline rather than a separate hot-stamping pass.
3.4 Textile Hangtags, Labels and Garment Trim (roughly 15%)
Tirupur, Ludhiana and the NCR garment cluster consume steady hangtag and woven-label decoration, including textile heat transfer foil for direct-to-garment metallic effects. Lower unit price than pharma, high repeat frequency.
3.5 Short-Run Digital and Everything Else (roughly 15-20%)
Digital toner-reactive foiling on HP Indigo and Konica Minolta fleets is small in tonnage and growing quickly in order count — see our note on digital toner reactive foil qualification. The remainder is food, gift packaging, publishing covers, lottery and scratch work using scratch-off foil.
4. Who Ships It, and From Where
Across China's whole export book the origin split is Zhejiang 29.5%, Guangdong 21.2%, Shanghai 16.5%, then Anhui and Jiangsu. On India-destined shipments my reading of the declarations is that Shanghai and Jiangsu carry more weight than their national share suggests, which is consistent with the specialty-grade mix — registered holographic and security product concentrates there. Zhejiang's Wenzhou cluster still supplies the broad conventional range, including premium metallic gold foil.
Departure is typically Ningbo-Zhoushan or Shanghai for Yangtze delta origin and Shenzhen for Guangdong. Arrival concentrates on Nhava Sheva for the Mumbai–Pune–Gujarat converter belt, Mundra for western India, and Chennai for the southern cluster. Realistic port-to-port transit is 12-18 days depending on routing and transhipment, which is three to four times a Vietnam run — a fact that quietly shapes everything about how Indian buyers hold stock.
That transit length is why Indian converters carry more foil inventory than their Southeast Asian counterparts, and why a supplier who can hold consignment stock or commit to a fixed monthly shipping slot has a structural advantage over one quoting three dollars cheaper.
5. Where the Growth Goes Next
Confidence levels vary and I will state them.
- Continued double-digit growth through 2027 — high confidence. The H1 2026 national book already stands at $18.62M against $32.08M for all of 2025, and the annualised 2026 projection is $37.24M, +16.1% year on year. India's share of that has been rising, not flat.
- Import substitution on commodity grades — high confidence, already happening. Indian domestic capacity will keep taking plain metallics. This is not a threat to the export line so much as a filter on what it contains.
- Specialty and security grades stay imported through 2028 — medium confidence. Registered holographic origination is a capital and know-how problem, not a labour-cost problem, and the qualification cycles with pharma customers are long.
- Price convergence toward the global average — low confidence. I would expect the India premium to compress somewhat as domestic capability climbs the specification ladder, but I do not see it collapsing inside three years.
6. Practical Guidance
If you are an Indian converter buying Chinese foil: put your acceptance criteria in writing before the first order — release temperature window, adhesion protocol on your actual substrate, batch-to-batch shade tolerance. Suppliers respond differently to a written specification than to a price enquiry, and it filters out the ones who cannot hold it. Given 12-18 day transit, qualify a second source at 15-20% of volume before you need one; a failed batch discovered on arrival is a five-week problem, not a five-day one.
If you are a Chinese producer entering India: do not lead with a discount against domestic mills — you will lose on landed cost and win nothing. Lead with the specification they struggle to hold consistently, and be prepared for a long qualification with pharma and excise-grade customers. Terms matter as much as price; Indian buyers work on credit cycles their downstream brands impose on them.
If you want the underlying tables — full destination ranking, province of origin, monthly series and the 2026 projection — the complete China Foil Export Report 2026 is free to download. For specification or sampling questions on any grade discussed here, talk to our technical team directly.
7. Where This Analysis Is Weakest
Two honest limitations. First, the vertical allocation in section 3 is reconstruction, not measurement — the customs record cannot see end use, and my Indian customer base skews toward pharma and cosmetics converters, which probably biases my weightings upward there. Second, I have limited visibility into the trading-intermediary channel serving India's very large tail of small print shops; my read of the market is a read of the direct-shipment segment. If your lived experience on either point differs, I would genuinely like to hear it.
Reviewed by Gavin Gao, Technical Director at All-in Pack. Fifteen-plus years across foil-substrate compatibility, register-control mechanics, Asian export operations and buyer-side technical support.
Data source: General Administration of Customs of China (GACC) export declarations under HS 32121000, January 2021 – June 2026: 7,379 aggregated records, 146 destination markets, 30 origin provinces, $149.47M and 21,331 tonnes in total.
Frequently Asked Questions
Quick answers about India packaging market.
Companion Products
Specs and samples for the products discussed in this article.
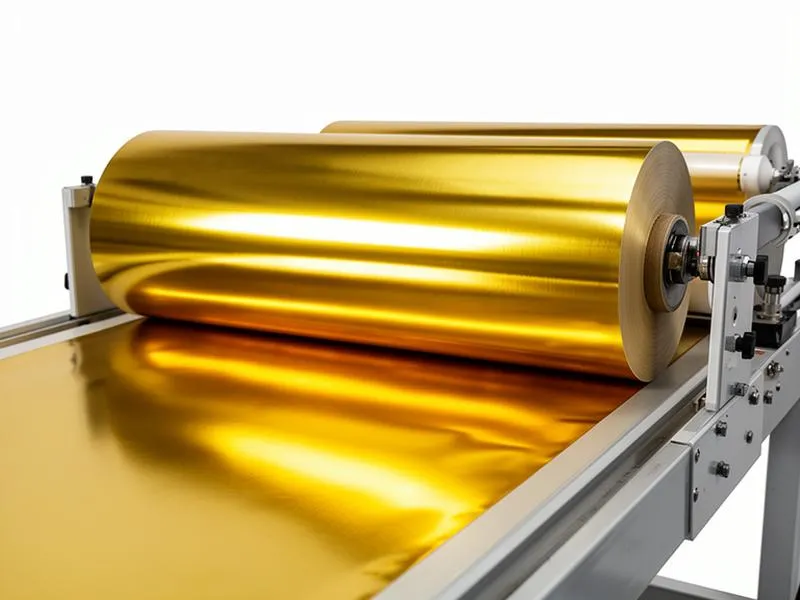
Premium Metallic Gold Hot Stamping Foil
Ultra-bright metallic gold foil with mirror-like reflection for premium packaging and label applications.
View product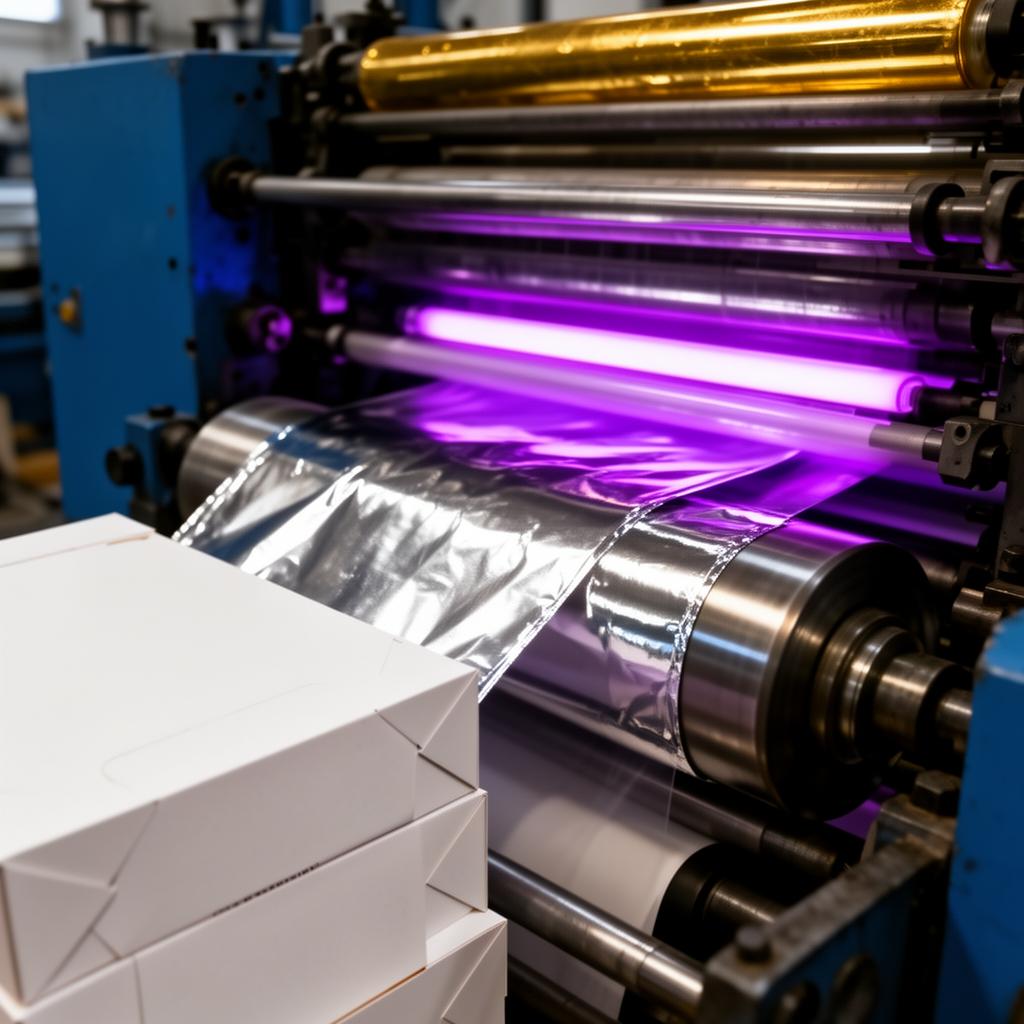
Cold Stamping Foil
Cold stamping foil for inline UV flexo and offset presses — no heat, no dies, up to 150 m/min with metallic, holographic and pigmented finishes.
View product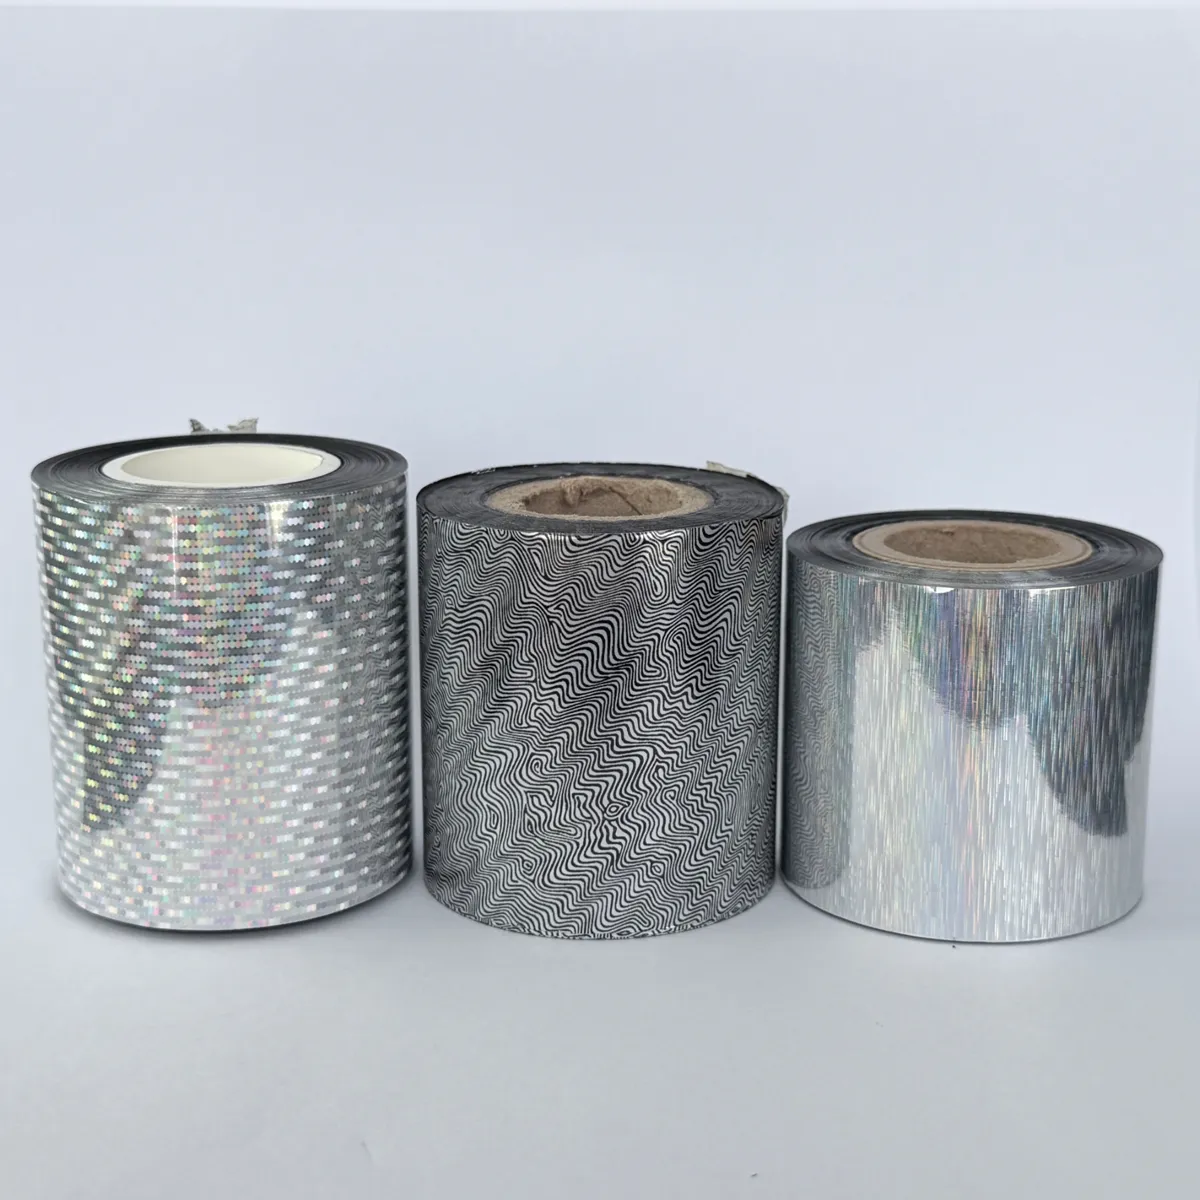
Scratch-Off Foil for Hot Stamping
High-opacity scratch-off foil for lottery tickets, gift cards and security labels — clean removal, no flaking, strong heat-seal bond to paper, cardstock and PVC.
View productRelated Articles
View all
Industry News · Aug 21, 2026
The Real Top 10 Chinese Hot Stamping Foil Manufacturers, Compared (2026)
An insider's honest comparison of the ten most relevant Chinese hot stamping foil manufacturers in 2026 — specialty area, typical customer, pricing position and where each one actually fits.
Industry News · Aug 24, 2026
Cold Foil Global Market Analysis 2026: What the Numbers Don't Tell You
A supplier-side read of the global cold foil market in 2026: market size, end-use verticals, regional demand, equipment concentration and where the segment is actually heading — with the confidence levels stated honestly.

Industry News · Feb 20, 2026
Self-Adhesive Label Market Asia: Growth Trends to 2026
Explore the growth drivers and opportunities of the self-adhesive label market in Asia, fueled by e-commerce and packaging demands. Find out more about this booming industry.
Ready to source foil stamping and die-cutting from one supplier?
From stamping foils to post-press machines and die-cutting consumables — get factory-direct pricing and free samples.