
Official Trade Intelligence · 2026 Edition
China Stamping Foil Export Report 2026: Official GACC Customs Analysis of HS 3212.10 (2021–H1 2026)
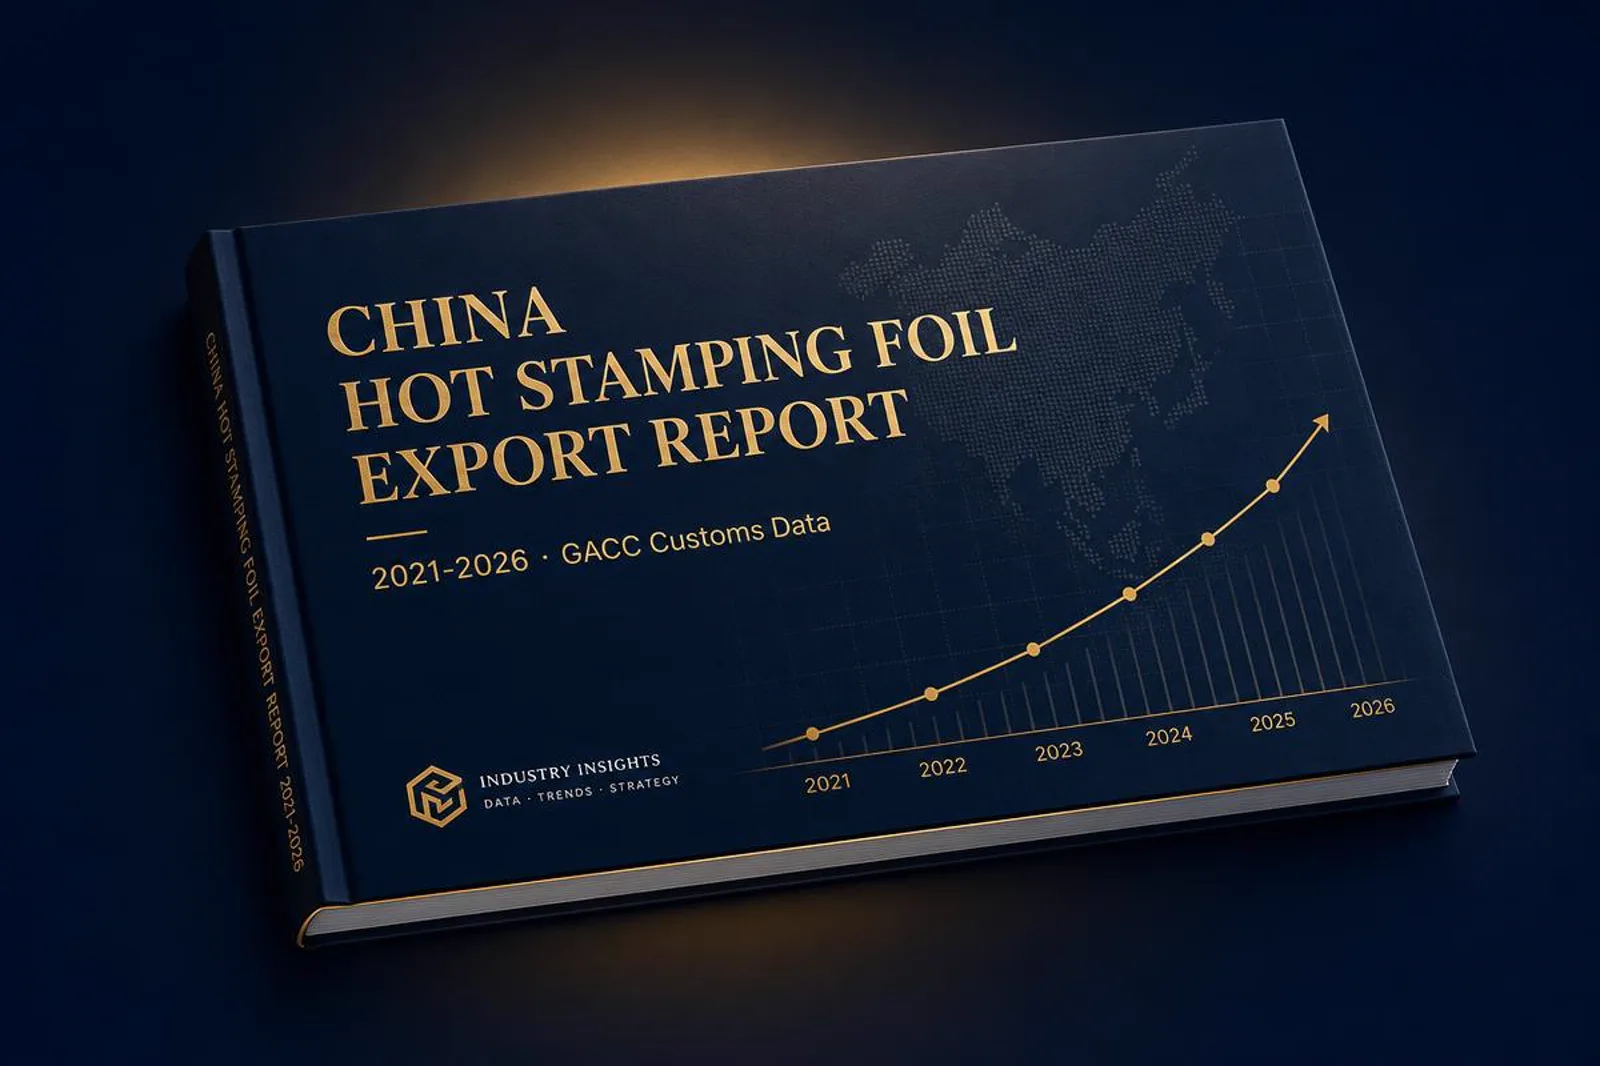
An independent analysis of Chinese export declarations for stamping foil (HS 3212.10) covering 66 months, compiled from General Administration of Customs of China records and reviewed by All-in Pack's technical team.
Between January 2021 and June 2026 China exported USD 149.47 million of stamping foil (HS 3212.10) — 21,331 tonnes to 146 destination markets, at an average unit price of USD 7.01/kg. The trade traced a U-shape: a 2023 trough of USD 17.86M, then +26.8% in 2024 and +41.6% in 2025 to USD 32.08M. H1 2026 already reached USD 18.62M, annualising to a five-year high of USD 37.24M. Vietnam (USD 29.47M), India (USD 23.40M) and South Korea (USD 17.31M) are the largest buyers; Zhejiang province accounts for 29.5% of export value.
- Total export value
- $149.47M
- Total volume
- 21,331 t
- Destination markets
- 146
- Average unit price
- $7.01/kg

Trusted by converters and distributors in 60+ countries
Download the full dataset (Excel)
Year-by-year and market-by-market tables from the same GACC extract
We use your details only to send the report. No third-party sharing.
01Executive summary
This report aggregates 66 months of export declarations filed with China's General Administration of Customs under HS 3212.10. It gives converters, distributors and packaging buyers a fact base for sourcing decisions through 2026.
Cumulative export value, 2021–H1 2026
2025 vs 2024; 2026 annualising to USD 37.24M
2025 average, down 32% from USD 8.76/kg in 2022
USD 29.47M and USD 23.40M cumulative, 35.4% of value
What the data shows: Chinese stamping foil exports traced a U-shape. Value fell 40.0% to a 2023 trough of USD 17.86M, then rebounded 26.8% in 2024 and 41.6% in 2025 to USD 32.08M — the strongest year in the dataset. H1 2026 has already shipped USD 18.62M, annualising to a five-year high of USD 37.24M.
Why it matters: The recovery is volume-led, not price-led. Tonnage rose from 2,507 t (2023) to 5,413 t (2025) while the unit price fell 32% from its 2022 peak to USD 5.93/kg. Vietnam, India and Russia absorbed the additional capacity; Malaysia, South Korea and Indonesia lost share.
What buyers should do next: Commodity-grade buyers should lock annual volumes while prices sit near a five-year low but lead times tighten. Buyers benchmarking quotations should use the market-level unit prices in Chapter 2 — Vietnam at USD 5.46/kg and South Korea at USD 13.38/kg bracket the realistic range.
02Key findings
- • U-shape recovery: after a 2023 trough of USD 17.86M (-40.0% vs 2022), exports rose 26.8% in 2024 and 41.6% in 2025 to USD 32.08M — the strongest full year in the dataset.
- • H1 2026 shipments of USD 18.62M annualise to USD 37.24M, which would be a five-year high.
- • India is the fastest-growing large market: USD 1.30M in 2021 to USD 6.96M in 2025, +434%.
- • Russia grew +2,384% (USD 0.14M to USD 3.44M) as buyers substituted Western suppliers.
- • Malaysia (-88%) and South Korea (-54%) are the largest declining markets since 2021.
- • Unit price collapsed 32%, from USD 8.76/kg in 2022 to USD 5.93/kg in 2025 — clear price-war evidence.
- • Zhejiang, Guangdong and Shanghai together supply 67.2% of exported value.
03Export trend, 2021 – H1 2026
Chinese stamping foil exports form a clear U. Value held near USD 29M in 2021–2022, collapsed 40.0% to USD 17.86M in 2023, then recovered to USD 22.65M in 2024 and USD 32.08M in 2025. Volume tells the same story more emphatically: 5,413 tonnes in 2025 against 2,507 tonnes in 2023. H1 2026 has already shipped 3,070 tonnes worth USD 18.62M.
| Volume (tonnes) | Export value (USD million) |
|---|---|
| 2021 | $28.49M · 3,743 t |
| 2022 | $29.77M · 3,399 t |
| 2023 | $17.86M · 2,507 t |
| 2024 | $22.65M · 3,200 t |
| 2025 | $32.08M · 5,413 t |
| H1 2026 | $18.62M · 3,070 t |
04Top destination markets
The top five buyers take 57.3% of export value and the top ten 72.4%. Vietnam leads with USD 29.47M (19.7%), ahead of India at USD 23.40M (15.7%) and South Korea at USD 17.31M (11.6%). The United States is only ninth at USD 3.91M (2.6%). Unit prices vary widely by market — from USD 5.46/kg into Vietnam to USD 13.38/kg into South Korea.
| 2. Top destination markets | Share of value (%) |
|---|---|
| Vietnam | $29.47M · 19.7% · $5.46/kg |
| India | $23.4M · 15.7% · $7.4/kg |
| South Korea | $17.31M · 11.6% · $13.38/kg |
| Malaysia | $8.47M · 5.7% · $8/kg |
| Russia | $6.92M · 4.6% · $5.73/kg |
| Indonesia | $6.69M · 4.5% · $7.77/kg |
| Belarus | $5.03M · 3.4% · $47.61/kg |
| Italy | $4.2M · 2.8% · $6.08/kg |
| United States | $3.91M · 2.6% · $9.72/kg |
| Pakistan | $2.73M · 1.8% · $5.02/kg |
| taiwan | $2.65M · 1.8% · $8.38/kg |
| turkey | $2.46M · 1.6% · $9.66/kg |
| Chile | $2.43M · 1.6% · $7.03/kg |
| spain | $2.21M · 1.5% · $6.8/kg |
| germany | $1.97M · 1.3% · $11.02/kg |
| brazil | $1.88M · 1.3% · $8.57/kg |
| thailand | $1.76M · 1.2% · $7.16/kg |
| poland | $1.75M · 1.2% · $3.56/kg |
| uae | $1.72M · 1.2% · $4.23/kg |
| iran | $1.68M · 1.1% · $3.92/kg |
05Rising and declining markets, 2021 → 2025
The five-year rotation is unambiguous. India (+434%) and Russia (+2,384%) drove the biggest rises, adding USD 5.66M and USD 3.30M of annual value respectively, while Malaysia (-88%) and South Korea (-54%) led the declines — with implications for both product mix and margin economics. Germany (-91%) and Egypt (-94%) fell furthest in percentage terms off small bases.
| 3. Rising and declining markets, 2021 → 2025 | Change 2021 → 2025 (%) |
|---|---|
| India | $1.3M → $6.96M · +434% |
| Russia | $0.14M → $3.44M · +2384% |
| Vietnam | $5.23M → $6.01M · +15% |
| Italy | $0.55M → $1.24M · +126% |
| United States | $0.54M → $1.15M · +113% |
| Malaysia | $3.93M → $0.49M · -88% |
| South Korea | $4.16M → $1.9M · -54% |
| Indonesia | $1.8M → $0.78M · -57% |
| germany | $0.79M → $0.07M · -91% |
| Chile | $0.95M → $0.33M · -65% |
06Unit pricing and the price war
If any single insight emerges from this dataset with unambiguous clarity, it is the 32% collapse in unit prices from the 2022 peak (USD 8.76/kg) to 2025 (USD 5.93/kg). This is not a statistical artefact — it is a strategic choice by Chinese producers to trade margin for market share. H1 2026 shows early stabilisation at USD 6.07/kg.
| 4. Unit pricing and the price war | Unit price (USD/kg) |
|---|---|
| 2021 | $7.61/kg |
| 2022 | $8.76/kg |
| 2023 | $7.13/kg |
| 2024 | $7.08/kg |
| 2025 | $5.93/kg |
| H1 2026 | $6.07/kg |
The divergence tells the story: 2025 volume jumped 69% (from 3,200 to 5,413 tonnes) but value grew only 42% (from USD 22.65M to USD 32.08M). The gap between those two growth rates is the price war made visible.
07Province of origin
Chinese stamping foil manufacturing is extraordinarily concentrated: the top three provinces — Zhejiang (29.5%), Guangdong (21.2%) and Shanghai (16.5%) — account for 67.2% of national exports. Anhui (7.7%) and Jiangxi (3.6%) are visible new entrants as coating capacity migrates inland from the coastal clusters.

| 5. Province of origin | Share of value (%) |
|---|---|
| Zhejiang | $44.09M · 29.5% |
| Guangdong | $31.69M · 21.2% |
| Shanghai | $24.66M · 16.5% |
| Anhui | $11.51M · 7.7% |
| Jiangsu | $9.12M · 6.1% |
| Jiangxi | $5.38M · 3.6% |
| Shandong | $4.19M · 2.8% |
| Fujian | $3.74M · 2.5% |
| others | $15.09M · 10.1% |
08Four countries that shaped the market
Four destinations illustrate the distinct forces reshaping the trade: Vietnam (stable anchor), India (structured growth with rising unit prices), Russia (sanctions-driven surge at collapsing prices, USD 12.50/kg to USD 4.91/kg) and South Korea (premium market flight, from USD 4.16M to USD 1.90M).
| 6. Four countries that shaped the market | Export value (USD million) |
|---|---|
| Vietnam 2021 | $5.23M · $5.28/kg |
| Vietnam 2022 | $5.37M · $5.43/kg |
| Vietnam 2023 | $4.07M · $6.07/kg |
| Vietnam 2024 | $4.06M · $5.3/kg |
| Vietnam 2025 | $6.01M · $5.09/kg |
| India 2021 | $1.3M · $6.54/kg |
| India 2022 | $3.44M · $7.91/kg |
| India 2023 | $2.38M · $6.33/kg |
| India 2024 | $5.97M · $10.61/kg |
| India 2025 | $6.96M · $6.86/kg |
| Russia 2021 | $0.14M · $12.5/kg |
| Russia 2022 | $0.75M · $12.36/kg |
| Russia 2023 | $0.09M · $15.2/kg |
| Russia 2024 | $1.26M · $5.54/kg |
| Russia 2025 | $3.44M · $4.91/kg |
| South Korea 2021 | $4.16M · $15.58/kg |
| South Korea 2022 | $4.28M · $15.04/kg |
| South Korea 2023 | $3.79M · $13.21/kg |
| South Korea 2024 | $2.33M · $11.41/kg |
| South Korea 2025 | $1.9M · $11.09/kg |
09Market segmentation by price tier
Plotting unit price against volume across the largest destinations, three tiers emerge: commodity below USD 6/kg (Vietnam, Russia, Poland, UAE), mid-range at USD 6–10/kg (India, Malaysia, Italy, Indonesia) and premium above USD 10/kg (Belarus, South Korea, Germany, United States). The premium tier is only around 15% of Chinese export value.
| 7. Market segmentation by price tier | Unit price (USD/kg) |
|---|---|
| Vietnam | $5.46/kg · 5,401 t |
| India | $7.4/kg · 3,160 t |
| South Korea | $13.38/kg · 1,293 t |
| Malaysia | $8/kg · 1,059 t |
| Russia | $5.73/kg · 1,207 t |
| Indonesia | $7.77/kg · 862 t |
| Belarus | $47.61/kg · 106 t |
| Italy | $6.08/kg · 691 t |
| United States | $9.72/kg · 402 t |
| Pakistan | $5.02/kg · 543 t |
| Türkiye | $9.66/kg · 255 t |
| Germany | $11.02/kg · 179 t |
| Brazil | $8.57/kg · 219 t |
| Poland | $3.56/kg · 492 t |
| United Arab Emirates | $4.23/kg · 407 t |
- Premium (over USD 10/kg): Belarus, South Korea, Germany, United States
- Mid-range (USD 6–10/kg): India, Malaysia, Italy, Indonesia
- Commodity (under USD 6/kg): Vietnam, Russia, Poland, UAE
10Seasonality
Shipments cluster ahead of Chinese New Year and again in the fourth quarter: January is the strongest month at 10.4% of cumulative value and November second at 9.7%, while February falls to 5.3% because of the holiday shutdown. Buyers planning Q1 deliveries should place orders before the January peak.
| Month | Share of value (%) |
|---|---|
| Jan | 10.4% |
| Feb | 5.3% |
| Mar | 8% |
| Apr | 7.8% |
| May | 8% |
| Jun | 8.1% |
| Jul | 9.3% |
| Aug | 8.1% |
| Sep | 9.1% |
| Oct | 7.7% |
| Nov | 9.7% |
| Dec | 8.7% |
11Customs trade regimes
General trade accounts for 89.1% of export value, with special customs zone logistics at 4.8% and bonded warehouse shipments at 2.3%. The dominance of general trade means the declared values in this report are close to true arm's-length export prices rather than intra-group transfers.
| Customs trade regime | Share of value (%) |
|---|---|
| General trade | 89.1% |
| Special customs zone logistics | 4.8% |
| Other regimes | 3.6% |
| Bonded warehouse | 2.3% |
| Border small-scale trade | 0.2% |
12Full-year 2026 outlook
Annualising H1 2026 gives USD 37.24M of export value on roughly 6,139 tonnes — 16.1% above 2025 and the highest level in the dataset. The projection is likely conservative: historically H2 outperforms H1 by around 8%. It assumes no change in the H1 run rate; it is an annualisation, not a demand model.
| 10. Full-year 2026 outlook | Export value (USD million) |
|---|---|
| 2023 | $17.86M |
| 2024 | $22.65M |
| 2025 | $32.08M |
| 2026 | $37.24M |
13What this means for buyers
Volume is expanding while unit prices sit near a five-year low, so buyers still hold negotiating leverage on commodity grades — but the 2025–2026 volume surge is tightening lead times. Lock annual volumes early, and treat the Vietnam and India price points (USD 5.46/kg and USD 7.40/kg) as realistic benchmarks when comparing quotations.
Commodity buyers
Standard-grade foil pricing remains at cyclical lows. Lock annual volumes now in the USD 5–6/kg tier before capacity discipline tightens.
Specialty buyers
Premium and security-grade foil above USD 10/kg is only around 15% of Chinese exports. Qualify Japanese, German and Korean second sources for holographic, security and toner-reactive grades.
Global competitors
Chinese pressure is concentrated in commodity segments. Premium niches — security foil, digital-reactive and holographic OVDs — remain relatively protected; differentiation, not price, is the defensible position.
14Methodology & data sources
All figures in this report are derived from export declarations filed with the General Administration of Customs of China (GACC) under HS code 3212.10 — stamping foils of a kind used in printing.
- Dataset
- GACC export declarations, January 2021 – June 2026 (66 months), 146 destination markets, 30 provinces of origin
- Aggregation
- FOB USD value, gross weight in tonnes, destination country and province of origin; general trade accounts for 89.1% of value
- HS scope
- 3212.10 covers hot, cold and digital stamping foils in rolls or sheets; specific foil types are not separated
- Forecast
- The 2026 figure is H1 2026 annualised at a constant run rate (USD 18.62M × 2 = USD 37.24M); it is not a demand model
- Limitations
- FOB values reflect declared prices; provincial origin is the exporter's registered location; unusually high unit prices in small markets (for example Belarus at USD 47.61/kg) reflect declaration practice, not market pricing
Methodology and findings reviewed by Gavin Gao, Technical Director at All-in Pack.
15Frequently asked questions
How much stamping foil does China export?
China exported USD 149.47 million of stamping foil under HS 3212.10 between January 2021 and June 2026, totalling 21,331 tonnes shipped to 146 destination markets.
What HS code covers hot stamping foil?
Hot stamping foil is declared under HS 3212.10, which covers stamping foils of a kind used in printing, whether or not put up in rolls or sheets.
Which country buys the most Chinese stamping foil?
Vietnam is the largest buyer with USD 29.47 million of cumulative imports (19.7% of value), ahead of India at USD 23.40 million (15.7%) and South Korea at USD 17.31 million (11.6%). The United States ranks ninth at USD 3.91 million.
Are Chinese stamping foil exports growing in 2026?
Yes. After a 2023 trough of USD 17.86 million, exports grew 26.8% in 2024 and 41.6% in 2025 to USD 32.08 million. H1 2026 reached USD 18.62 million, which annualises to USD 37.24 million — a five-year high.
What is the average export price of Chinese stamping foil?
The average declared unit price across the full period is USD 7.01/kg. It peaked at USD 8.76/kg in 2022, fell 32% to USD 5.93/kg in 2025, and stood at USD 6.07/kg in the first half of 2026.
Which Chinese province exports the most stamping foil?
Zhejiang accounts for 29.5% of export value (USD 44.09 million), followed by Guangdong at 21.2% and Shanghai at 16.5%. Together these three provinces supply 67.2% of exports.
Which markets are growing fastest?
Between 2021 and 2025 India grew 434% (USD 1.30M to USD 6.96M) and Russia 2,384% (USD 0.14M to USD 3.44M). Malaysia fell 88% and South Korea 54% over the same period.
Where does the data in this report come from?
All figures are aggregated from export declarations filed with the General Administration of Customs of China (GACC) under HS 3212.10, covering 66 months from January 2021 through June 2026 across 146 markets and 30 provinces.